

FlowmapBlue
FlowmapBlue


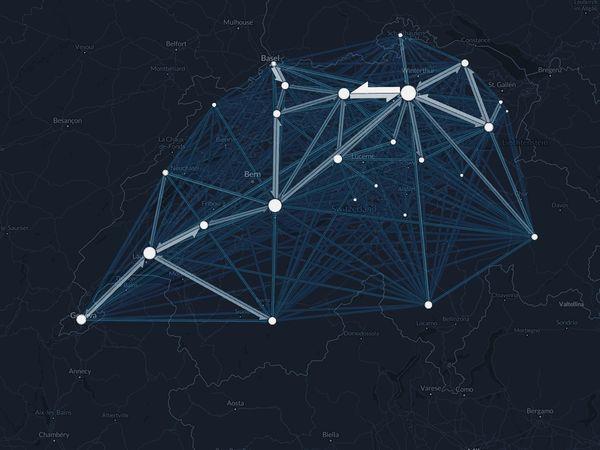
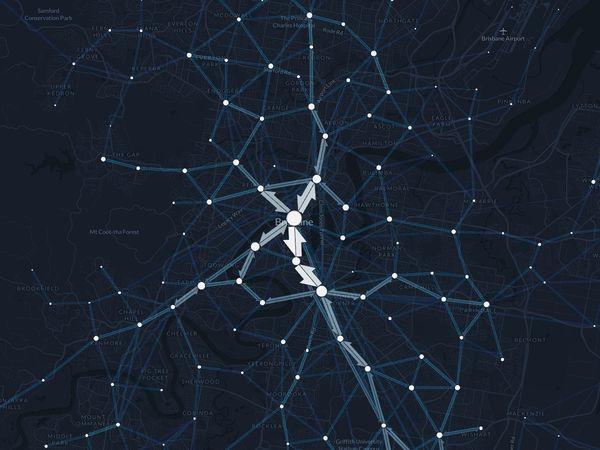
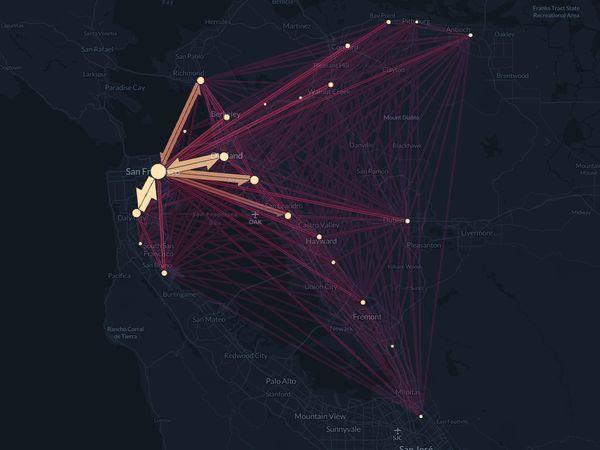
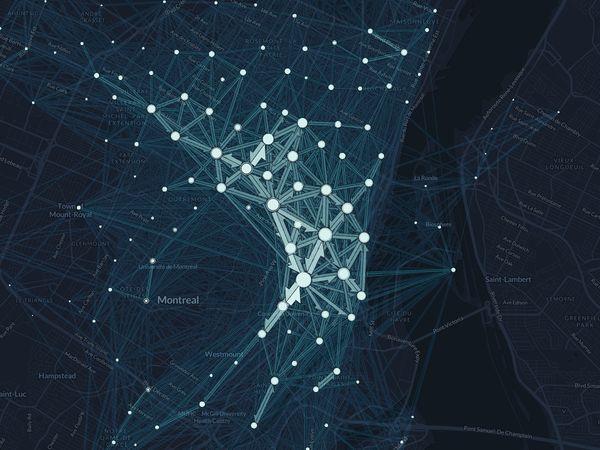
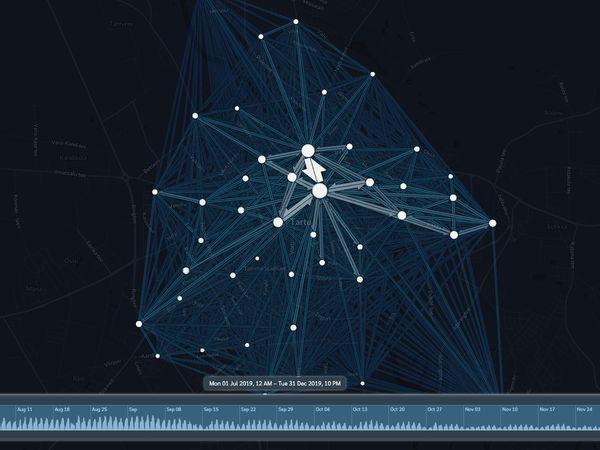
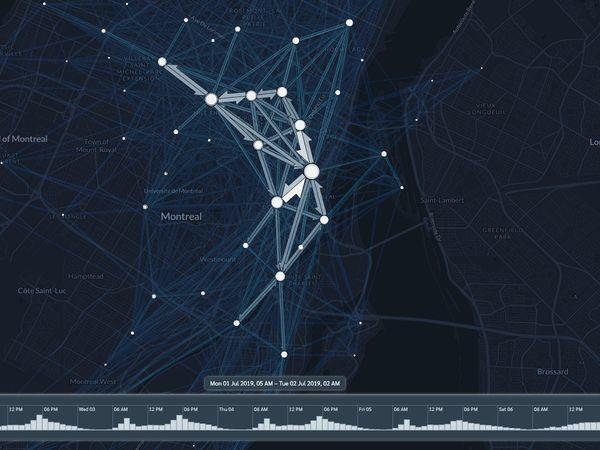
Create geographic flow maps representing numbers of movements between locations.
Visualize your own origin-destination data published in Google Sheets.
Explore the data interactively.
What is it for?
FlowmapBlue is used to visualize various real-world phenomena in which pairs of locations are involved:
Urban mobilityCommutersPedestrian movementBus travels Metro ridesTrain ridesAir travelsMarine trafficBicycle sharingScooter sharingCar ride sharing Taxi ridesInternal migrationInternational migrationRefugeesHuman trafficking Drug flows Freight transportation Material flowsTrade Bird migrations Livestock movements Plant migrationUrban infrastructureSewage flowsWaste managementSupply chain EpidemiologyHistorical journeys Scientific collaborations

Who is using it?


How to make a flow map?
Follow the steps described on this page.
Latest news
Sept 1, 2023
Releasing Flowmap City, the new product we are building. It offers secure data storage, more analytics capabilities, improved scalability, an SQL query editor, and more coming. Check it out here.
Jun 28, 2022
Sep 01, 2021
Feb 25, 2021
Jul 01, 2020
Credits
Developed by Ilya Boyandin using deck.gl, flowmap.gl, mapbox, d3, blueprint, CARTOColors.
With kind support from


Open Source
FlowmapBlue source code is free non-commercial usage. If you want to use it in a commercial project, please reach out to us.
This work is licensed under a Creative Commons Attribution-NonCommercial 4.0 International License.


Please make sure to include proper attribution. Use one of these images and link them to the FlowmapBlue website:


Awards
